¶ Evaluate radio link quality of a gateway
¶ RSSI/SNR distribution
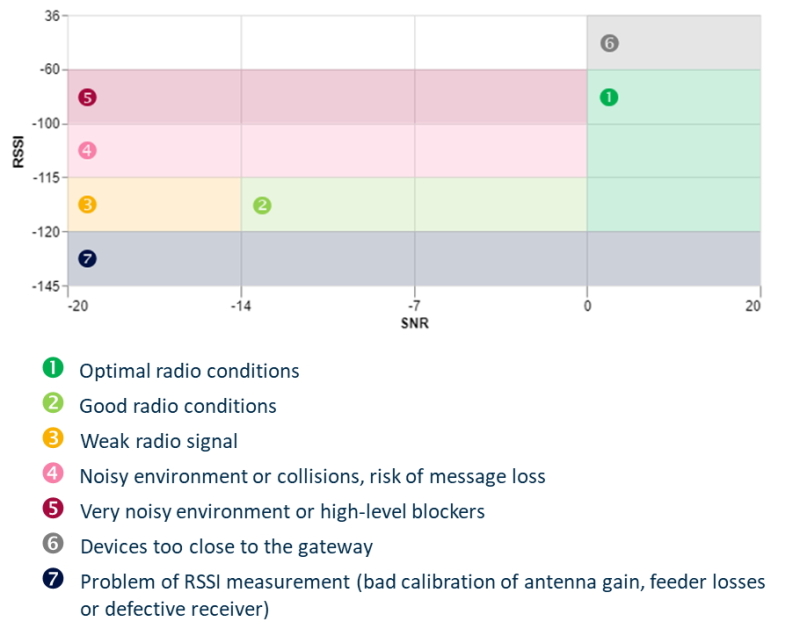
The KPI graph RSSI/SNR distribution is a heatmap representing the percentage of messages received over the last hour, by range of SNR and RSSI values.
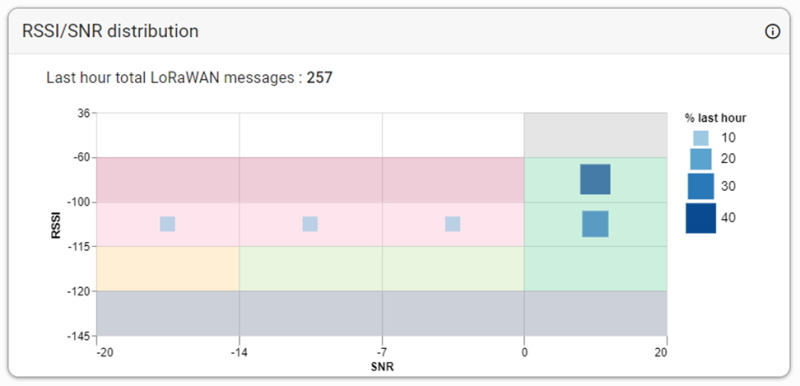
The message reception area should be considered to evaluate the radio link quality of the gateway.